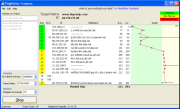
PingPlotter is a small but very useful tool bringing fast, effective and graphical traceroute-based troubleshooting information. With graphical output, multi-threaded query engine and "copy as image" capability, PingPlotter is useful tool for individuals who need a light-weight, no-cost tool for running repeated traceroutes to a target.
PingPlotter has a freeware version and feature rich Standard and Pro editions that one can buy.
PingPlotter is particularly very useful for the fact that it can graphically show where there is a lag (latency or delay) or if the destination is not reacheable which node is actually having a problem.
A sample output for http://www.itsyourip.com/ from PingPlotter
How PingPlotter works
PingPlotter uses the concept of "traceroute" to do its work. The "traceroute" (or "tracert" under Windows) utility has been a core network troubleshooting tool for a number of years. PingPlotter takes this core concept, and then adds long-term monitoring, graphical displays, saving of data, alerts and a myriad of other useful features.
The performance of a network target (i.e.: web site, service or similar) can be measured by sending a ping packet. Your computer sends a "packet" of data (sometimes called an "echo request") to a remote computer or router. When this remote computer or router receives this data, it responds back (sometimes called an "echo reply"). If we measure the time it takes for the packet to get to that site, and then return to you, we call this the ping time or latency. In general, the lower this is, the better your connection to a site. Usually this time is specified in milliseconds (1/1000 of a second). The abbreviation for milliseconds is ms.
This ping time is displayed in PingPlotter as the response time in milliseconds of the final destination (also called "Round Trip Time" – the time it takes a packet to travel the full round trip). PingPlotter also shows the latencies / times of the intermediate hops. This is interesting in case the target server isn't responding, or responds slowly. We might want to understand if any of the routers in between you and that target server are causing the problem. Any Internet data will certainly go through a number of servers, and we want to find out how well these respond.
We can determine this information by changing the TTL information in a packet. The TTL portion of a packet is used to make sure a packet never gets involved in an endless loop, but we use it to tell the intermediate routers to send data back to us. For more information on this, see our tutorial on this topic. PingPlotter sends out one packet of data for each router in the path. As each router responds, we record the data. We call each of these a hop.
The last hop in a (successful) traceroute is actually the round-trip time to the destination server. This is an important concept to understand. You don't add up all the times between you and the destination host. That time has already been added. The time to the last hop in the chain is exactly the same as is if you'd used a ping utility to that host. So a traceroute utility is actually two utilities, ping and traceroute.
